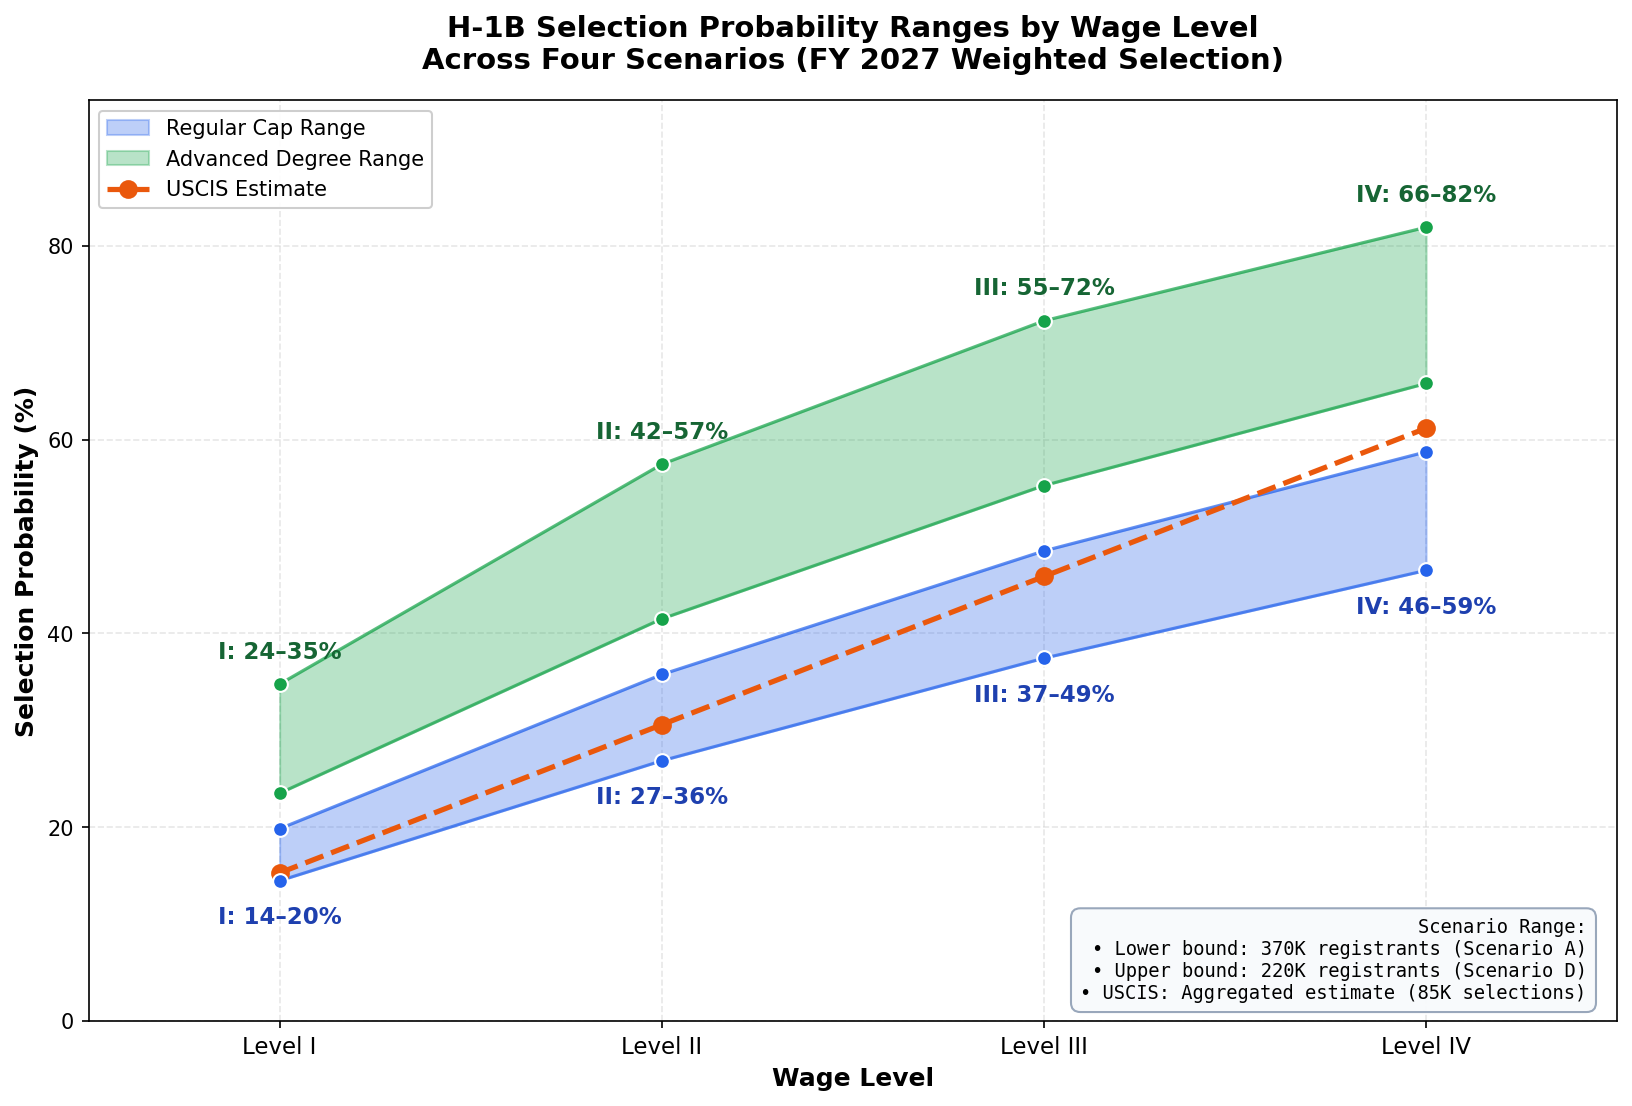
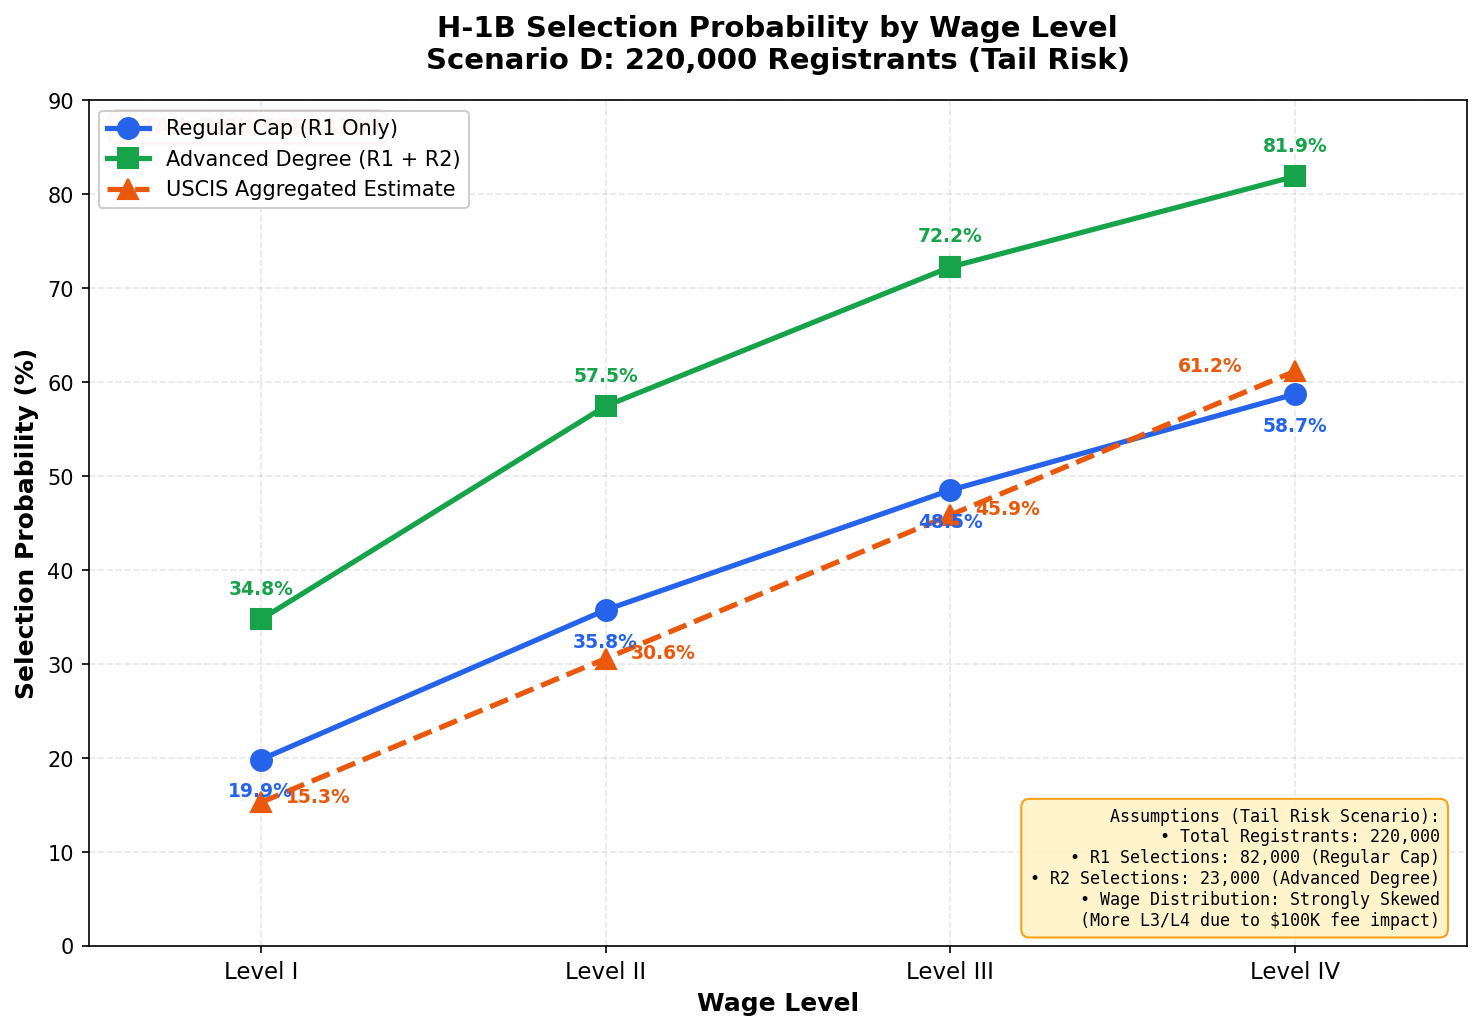
Using USCIS’ data and this methodology, we can estimate a registrant’s probability of selection in the lottery by wage level and degree. The biggest unknown, however, is the number of total registrants, which, as the methodology details, have varied greatly recently. For this reason, running the analysis under several scenarios makes sense.

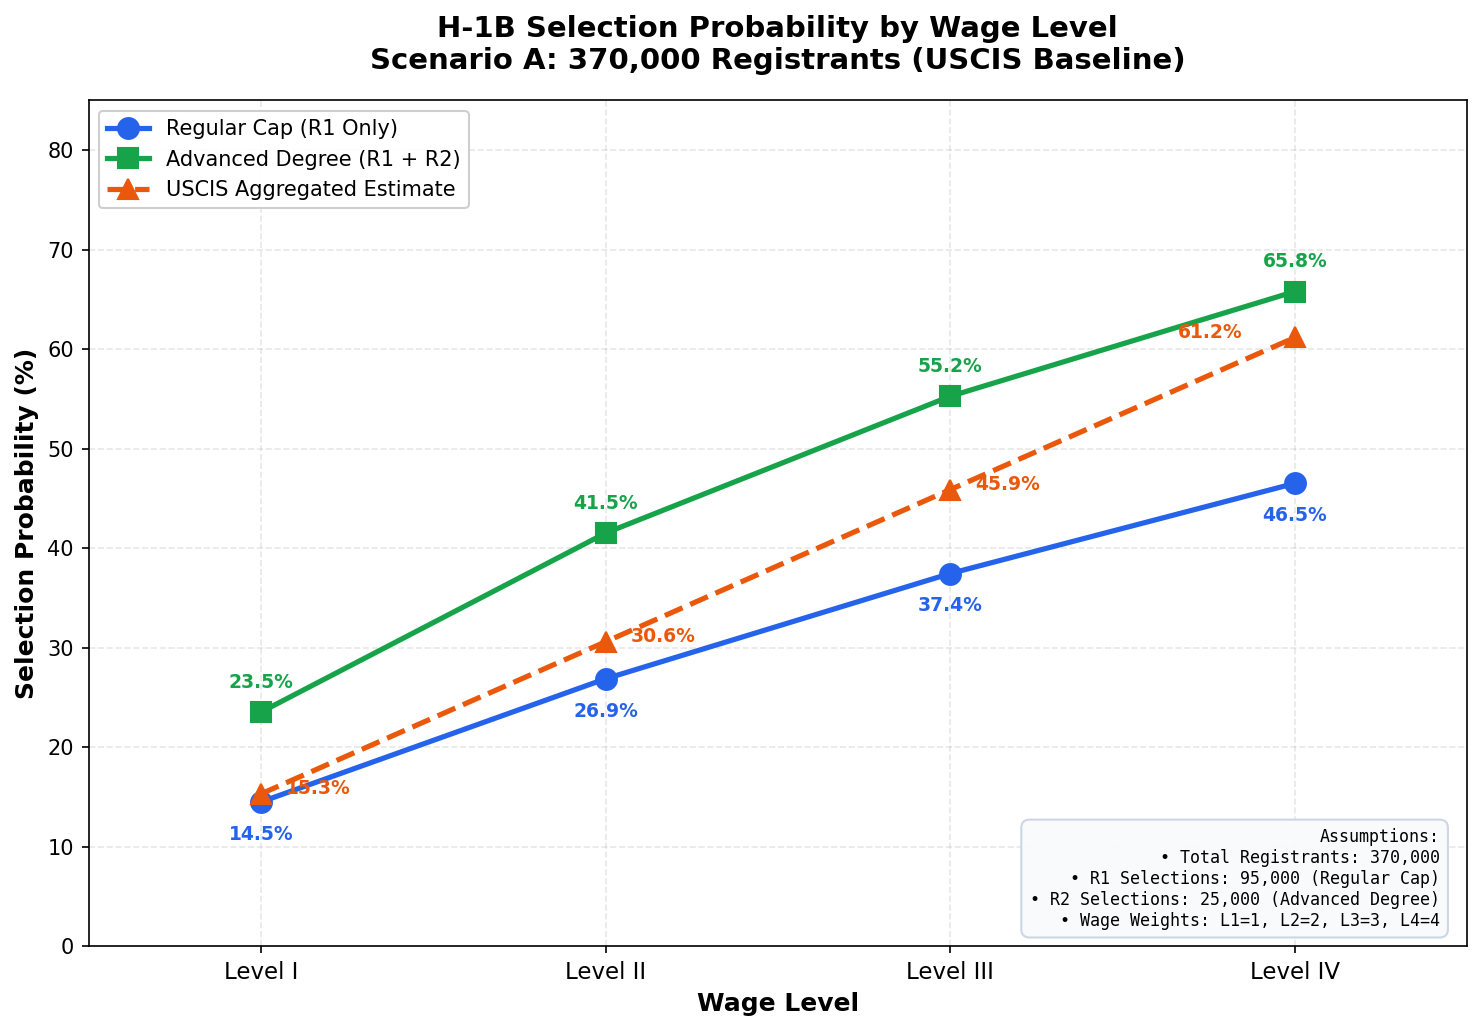
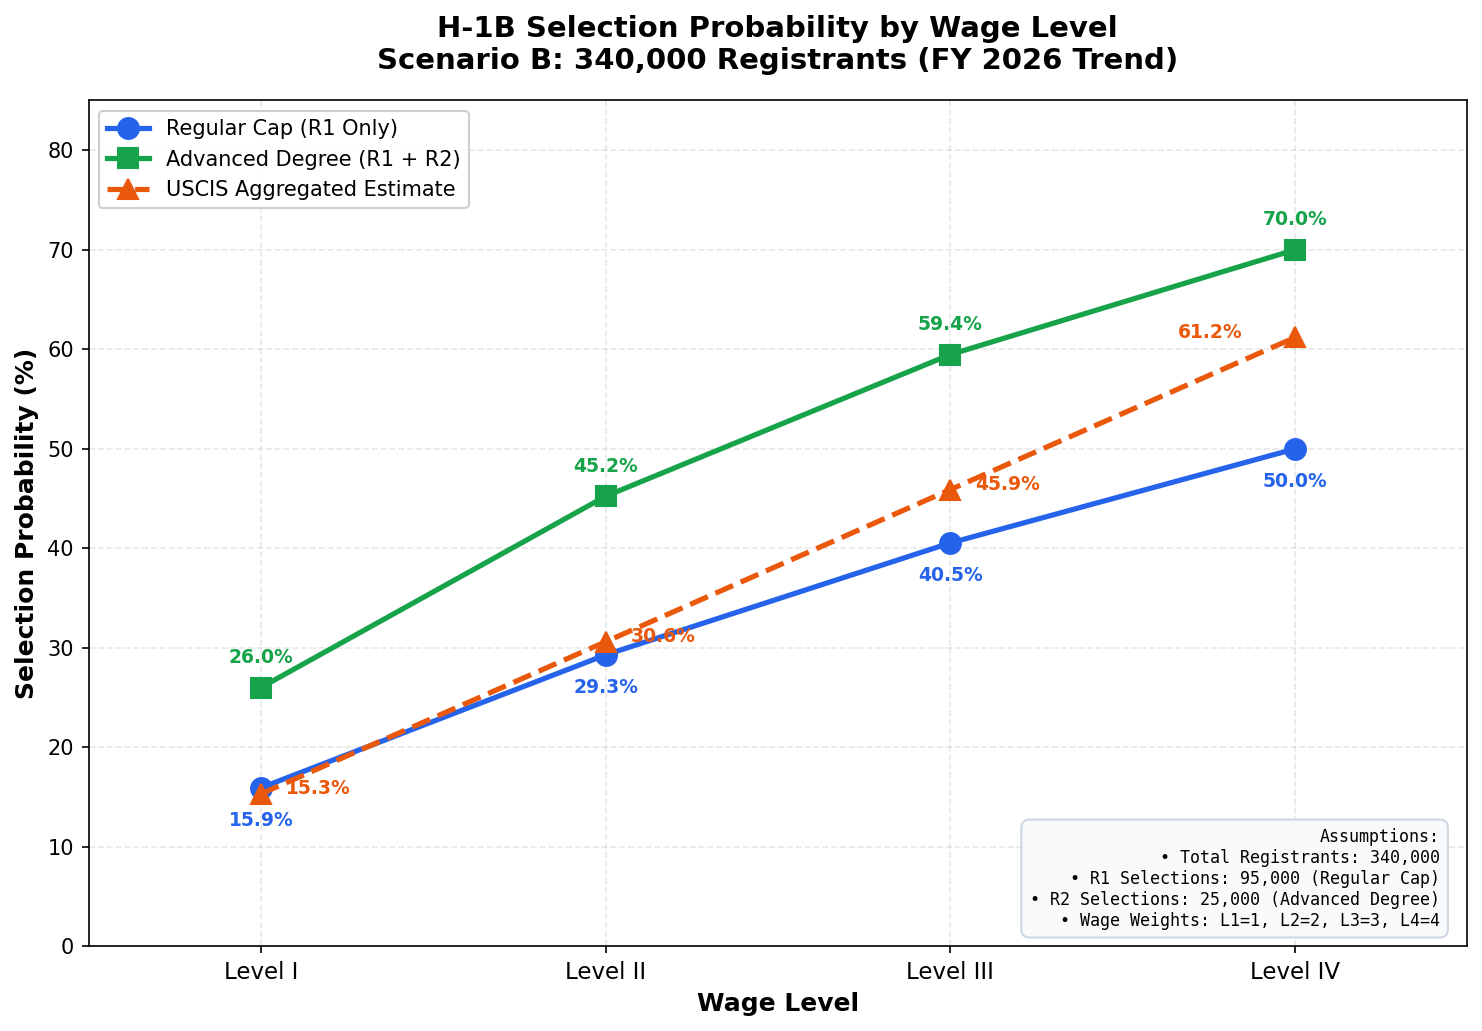
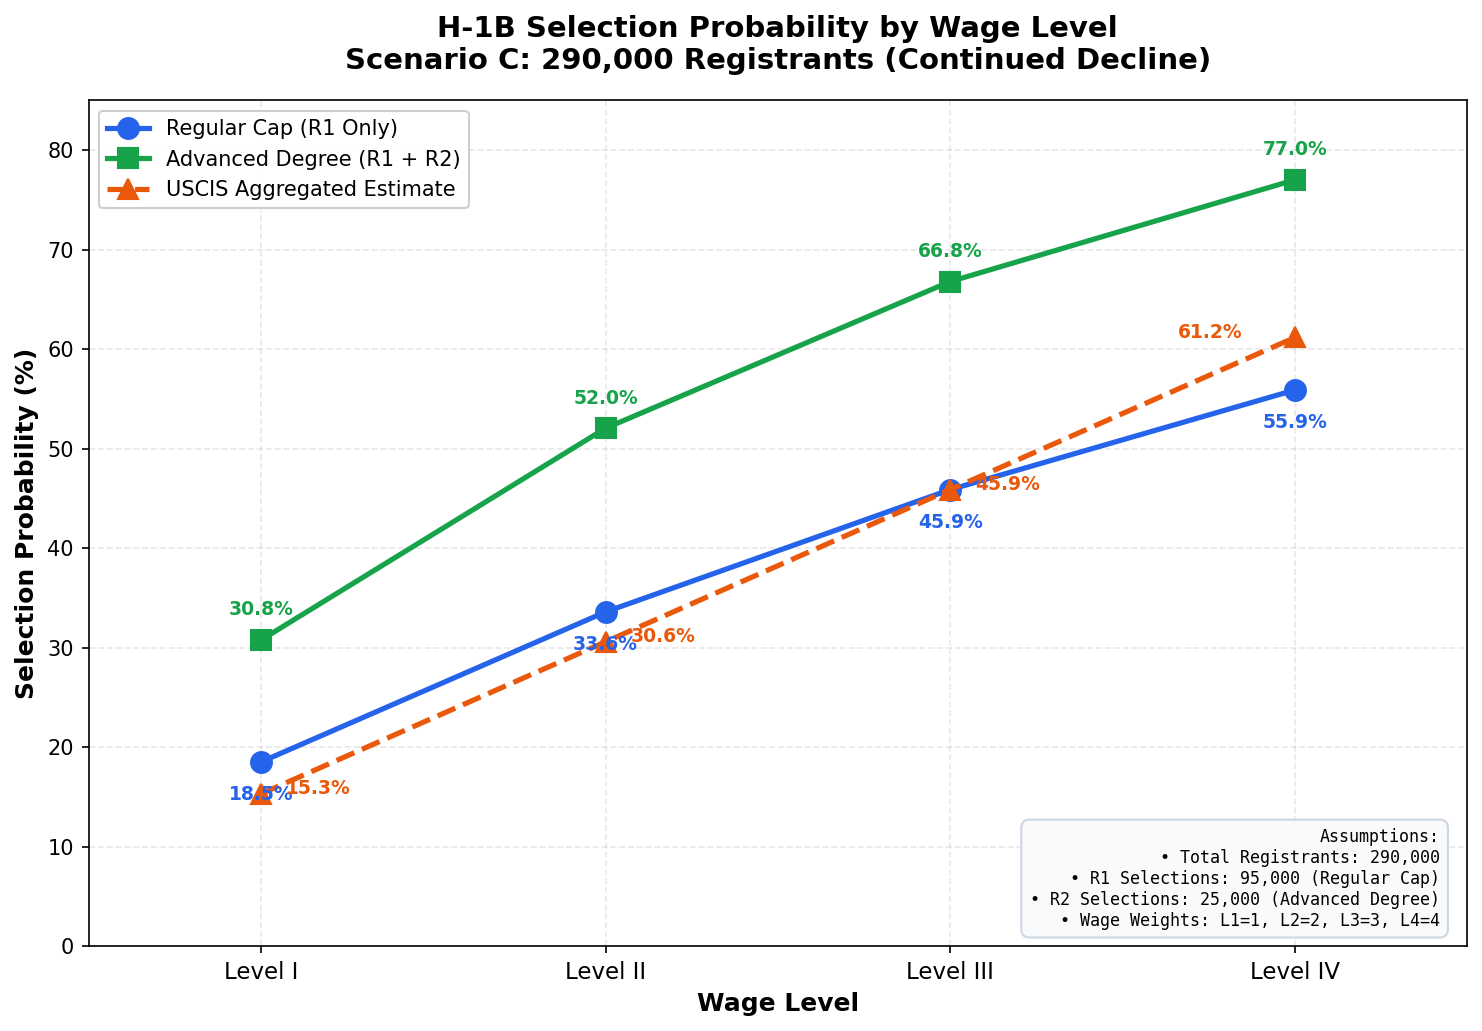
From a high estimate of 370,000 unique registrants to a low of 220,000, the charts below show the full range of scenarios, followed by each individual scenario.


Chart showing higher probability of selection based on wage level, and to a lesser extent, degree level-range of 4 scenarios


Chart showing higher probability of selection based on wage level, and to a lesser extent, degree level-370,000 registrants


Chart showing higher probability of selection based on wage level, and to a lesser extent, degree level-340,000 registrants


Chart showing higher probability of selection based on wage level, and to a lesser extent, degree level-290,000 registrants


Chart showing higher probability of selection based on wage level, and to a lesser extent, degree level-220,000 registrants