A few months ago, USCIS published the analysis that informed their decision to implement the weighted selection process for the H-1B cap lottery. Based on this data, they estimate the probability of selection in the lottery by wage level (roughly 15%, 30%, 46%, and 61%).
But these numbers aggregate all registrants by wage level, regardless of their degree level. In reality, registrants with advanced degrees have a higher chance of success than those with bachelor’s degrees because of the two-stage selection process.
How much higher? Using USCIS’ data, advanced degree holders likely have about a 1.5X chance of being selected, or about a 50% greater chance compared with regular degree holders. Wage level, as intended, has a much greater overall impact on probability of selection.
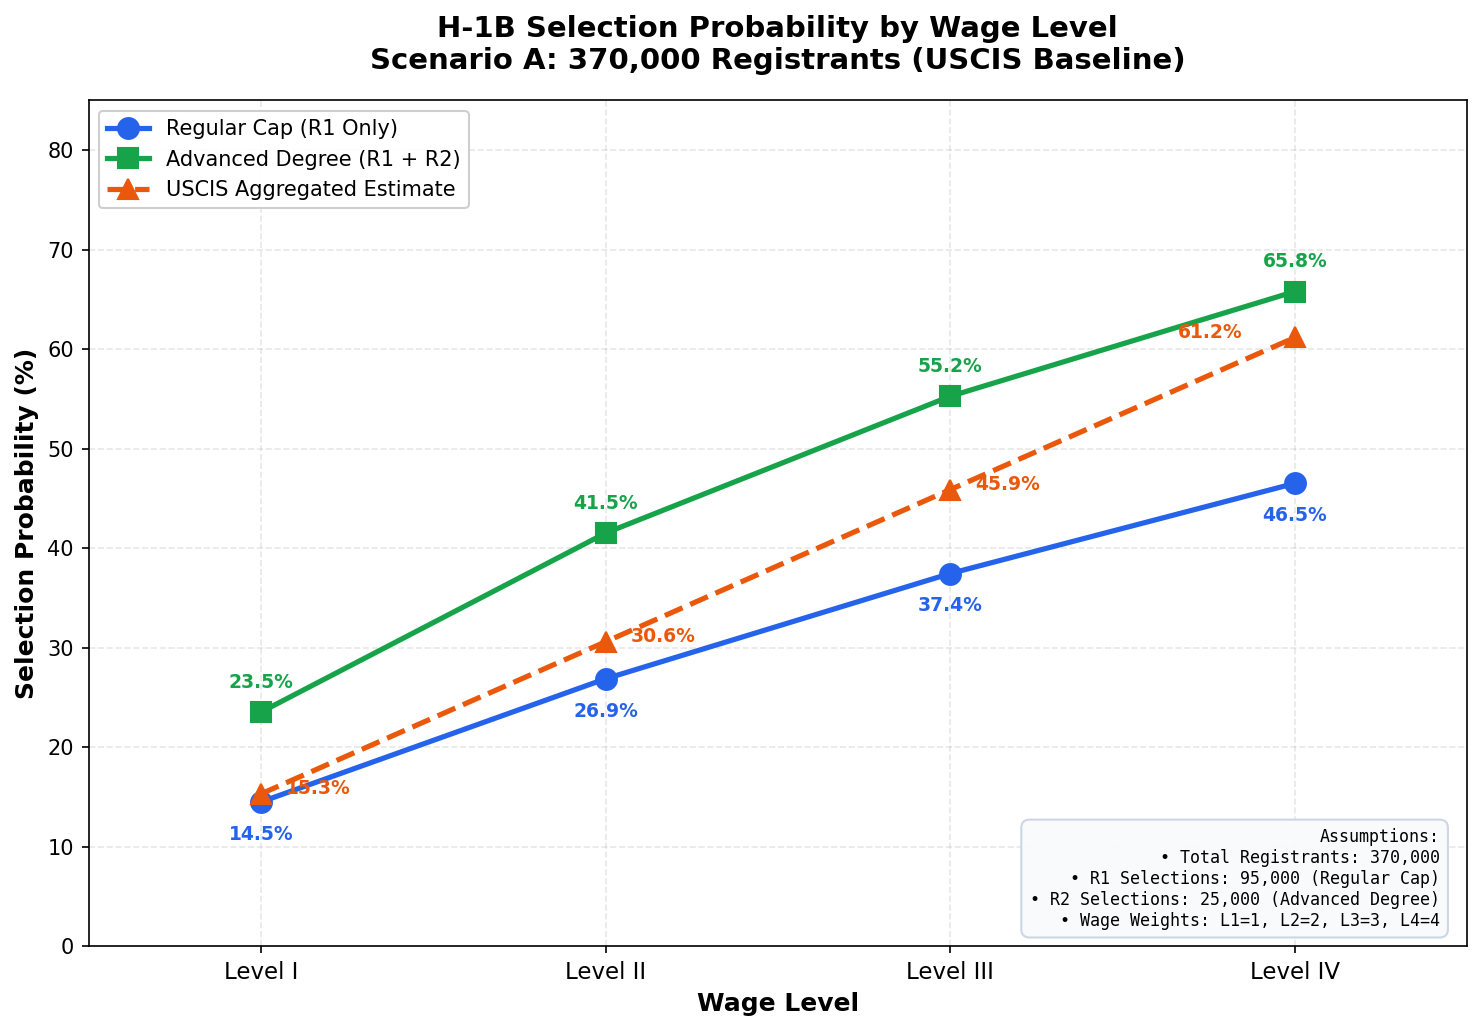
Based on USCIS’ estimate of 370,000 registrants, and using their estimates of the distribution between regular and advanced degrees and the four wage levels, probabilities of selection can be estimated for each wage level and degree pool.
Estimate with 370,000 Registrants
| Wage Level — | Regular Cap — | Advanced Degree — |
|---|---|---|
| Level I | 14.48% | 23.51% |
| Level II | 26.86% | 41.50% |
| Level III | 37.44% | 55.25% |
| Level IV | 46.50% | 65.78% |
One major difference: in their analysis, USCIS estimates about 95,000 selections for the 85,000 visas, accounting for withdrawals, denials, and abandoned registrations and petitions. The actual number has been higher the last several years. In fact, it hasn’t been less than 120,000 in the last six years, and has been much higher in some years (188,000 in 2024). The extra selections are almost entirely used in the regular cap pool; apparently, advanced cap registrants are much more likely to follow through, and succeed with their petitions. For this reason, I conservatively use 120,000 registration selections in the analysis. This of course, leads to higher overall selection probabilities, but this seems appropriate, as the intent is to provide the actual probabilities based on recent statistics, not simply mirror USCIS’ analysis while accounting for different degree levels and selection stages.
The methodology, including a link to a spreadsheet with the analyses, can be found here. I also ran additional analyses with different registrant totals: 340,000 (similar to last year’s total), 290,000 registrants (reflecting a moderate continuation of the recent downward trend) and 220,000 registrants. The latter represents an amplification of these trends, plus the possible effect of the $100,000 fee, discouraging applicants from abroad. Charts for the additional analyses are here.